Dashboards enable users to group together pieces of information in a panel-like view. As a dedicated module of IntelligenceBank, Dashboards are typically accessible as a tab within your platform's navigation bar, but they can also be set as a homepage.
Depending on how a user group's permissions are set up, users can view, edit, create, or have admin permission to dashboards within the platform.

Table of Contents
Key Benefits
Dashboards provide information at a glance around key priorities for users. They are particularly helpful for managing workflows and offer insight and visibility into things users may need to keep on top of or potentially action, such as assets expiring soon, or tasks approaching their due date.
Having this type of information accessible in a dashboard makes it easier for users to visualise what they need to action and minimises the chance for action items to get "missed".
There are various tools/areas of the platform that can be pulled into a dashboard via widgets (see further section below for more details). These tools and some relevant examples include:
- Assets/Resources - displays information related to your assets (ie: all assets added in the last 30 days or assets coming up for review in the next 60 days).
- Databases - displays information related to your database records/briefs (ie: recently added tasks, tasks still in progress, or overdue tasks).
- Approvals - displays information relating to any approval workflows you've set up (ie: pending requests with a required by date of next week).
- Markup Comments - displays information around any markup comments made on assets (ie: all unresolved comments or comments I've been @mentioned in).
How to Create a Dashboard
Users with permission to create dashboards can do so by following the below steps:
| 1 | Select Dashboards from the navigation bar. |
| 2 | Select the icon noted in the red square below in the top left of the dashboard page, which will open your dashboards panel. You will be able to see any existing dashboards here as well.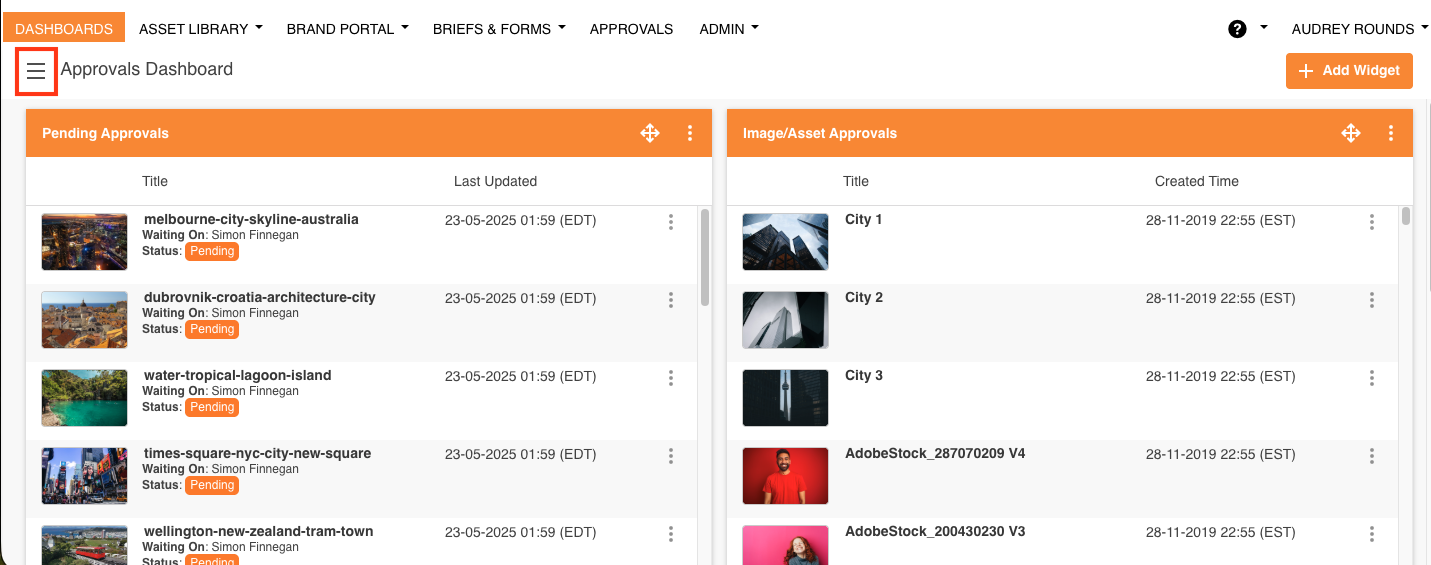 |
| 3 | Select + Add Dashboard.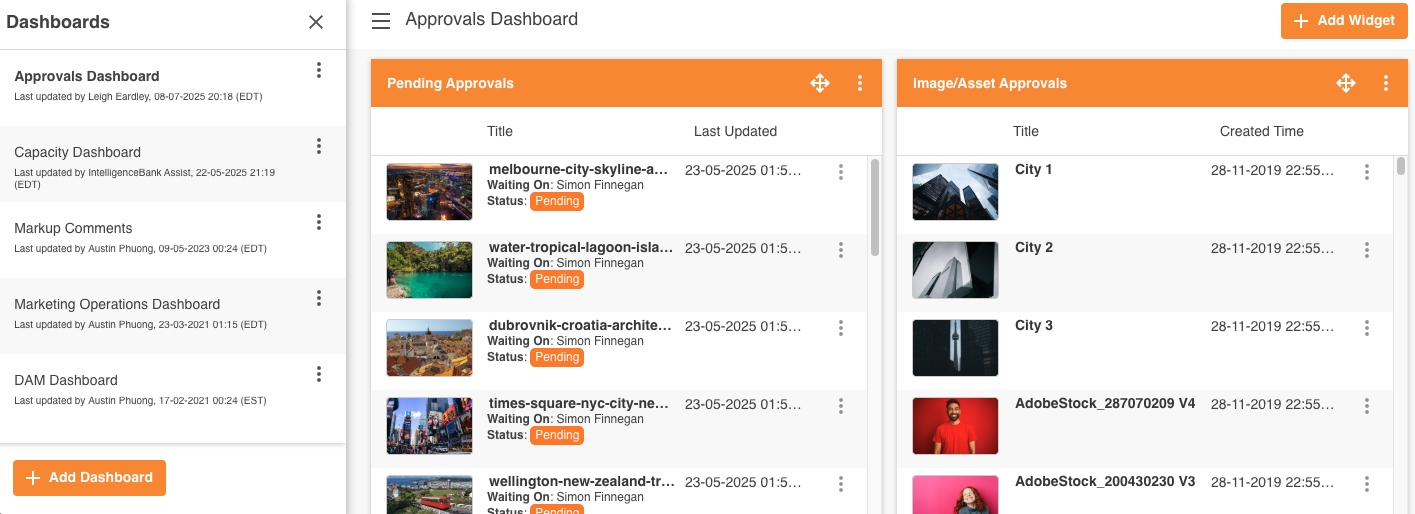 |
| 4 | In the Main Details page, enter a Dashboard Name. You can also decide if you want this dashboard to be Private (for only you to see) or to enable others to view it. Toggle the Private setting on if you want it to be private.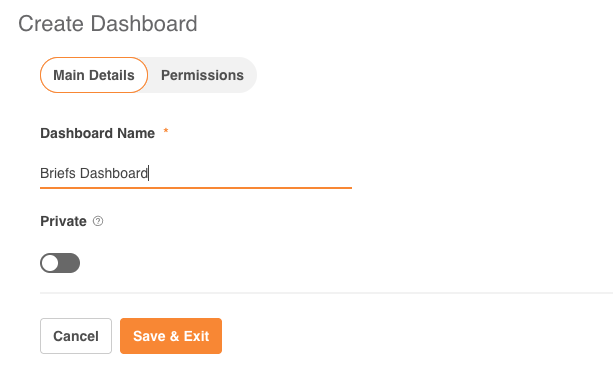 |
| 5 | If you'd like to set permissions on the dashboard at this juncture, select the Permissions tab and determine which user group(s) should be able to View or Edit your dashboard. Note that if the dashboard is created as Private, this will override any group permissions you may set. |
| 6 | Select Save & Exit to save your dashboard. |
What are Dashboard Widgets?
Once you create a dashboard, you'll need to add widgets within your dashboard to display the information at a glance you'll find valuable.
A widget is a small application that users can use to populate and display their data. You can add multiple widgets to a single dashboard as well.
There are several types of widgets, and they are all useful for particular scenarios. Below are the current widgets available:
- Item List widgets: these will display data in a list view within your dashboard. These are helpful if you want to see a list of relevant items you may need to take action against (ie: a list of pending approvals waiting on my response, or a list of tasks still in progress).
- Calculation widgets: these allow you to easily keep track of:
- Workload Management: View a count of pending approvals or project tasks awaiting your action.
- Track Progress & Spend: Track the progress of project tasks or of your budget spending.
- Review Expiring Assets: Keep on top of your usage rights by monitoring assets that will be expiring soon or already have.
- Grid Matrix widgets: these allow you to select from two select fields within a database and display how many records match a combination of these values. The most common example of where this type of widget is used is in a risk matrix heatmap. You can instantly visualise the risk profile of your projects or records in a customisable view.
For more details on how to create these widgets and the information available to display, please refer to the articles on item list, calculation, and grid matrix widgets.
Setting a Default Dashboard
You can select one of your dashboards to be your default. Your default would open whenever you access the Dashboards module, saving you time if there's a particular dashboard you view or interact with most frequently.
How to set your Default Dashboard
| 1 | Open your Dashboards side panel. |
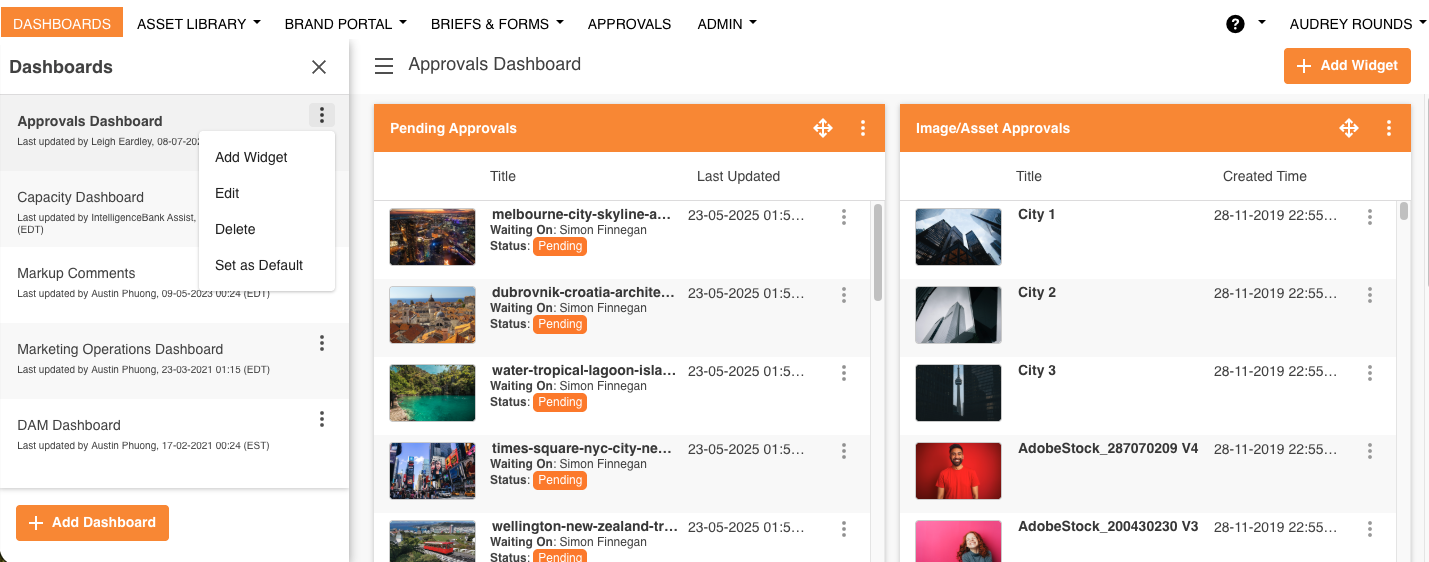
| 2 | Click the More Menu (3 dots), that appears next to each Dashboard in the list. A menu will appear that enables various actions, like editing, deleting or adding a widget (subject to your permission level). |
| 3 | To classify the Dashboard as the default, click Set as Default.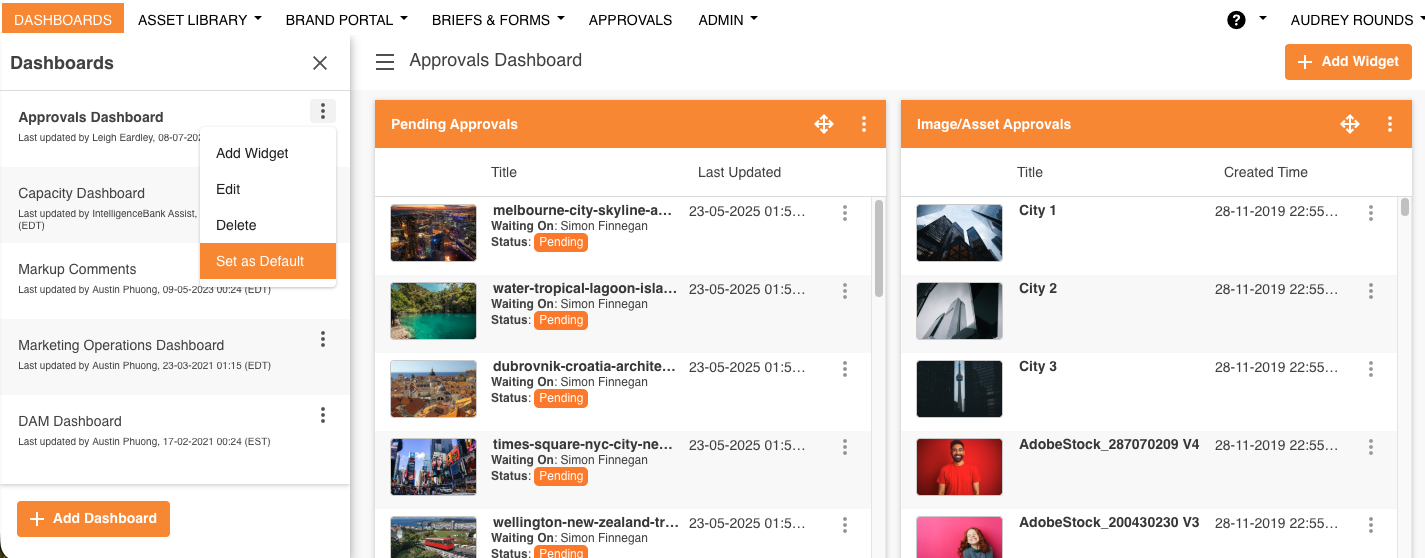 |
| 4 | Your default will be automatically updated and is indicated by a small tick, next to the dashboard name.  |
Managing Multiple Dashboards
If you have the appropriate permission level (ie: Create), you can add multiple dashboards at any time, all with the option of either being private or a shared dashboard.
When on a dashboard page, click the 'hamburger' menu icon on the top left of the Dashboard page. This will open the Dashboard Menu. To add a new dashboard, select the + Add Dashboard button, as outlined in the How to Create a Dashboard section.

In this menu side-bar, you'll also be able to view any other dashboards you have permission to access, and can click into any dashboard to open it. Select the three vertical dots next to each dashboard to add a widget, edit, or delete the dashboard (subject to your permission levels).
Editing, Resizing, and Ordering Widgets on a Dashboard
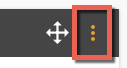
To edit your dashboard widgets, click into the three circles on the top-right of the widget container.
Then, select Edit from the options. (Note that you can also Delete the widget this way.)
This will then take you back to the steps of creating a widget where you can then make the required update, remembering to Save & Exit when complete.
To reorder your dashboard widgets, click the move icon also located at the top-right of the widget container:

Then, drag the widget to the required location on the dashboard page. If you have multiple widgets within your dashboard this is also how you can change their order on the page.
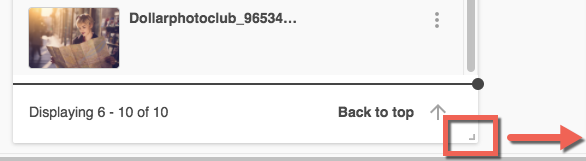
You can also expand or reduce the width of each widget, by clicking the icon on the bottom right corner and dragging it right or left.
Note, only item list and grid matrix widgets can be expanded or reduced in size.
Was this article helpful?
That’s Great!
Thank you for your feedback
Sorry! We couldn't be helpful
Thank you for your feedback
Feedback sent
We appreciate your effort and will try to fix the article