Usage Reports give admins visibility into how the platform is being used - most notably, around which users are most active and which content is most popular.
Table of Contents
Accessing Usage Reports
Usage Reports are available to admins from the Admin panel. To get there:
| 1Go to Admin | Navigate to the Admin panel from the main navigation. |
| 2Open Reporting | Select Reporting from the Admin menu. |
| 3Select Usage Analytics | Click Usage Analytics to open the Usage Reports. |
Filtering Reports
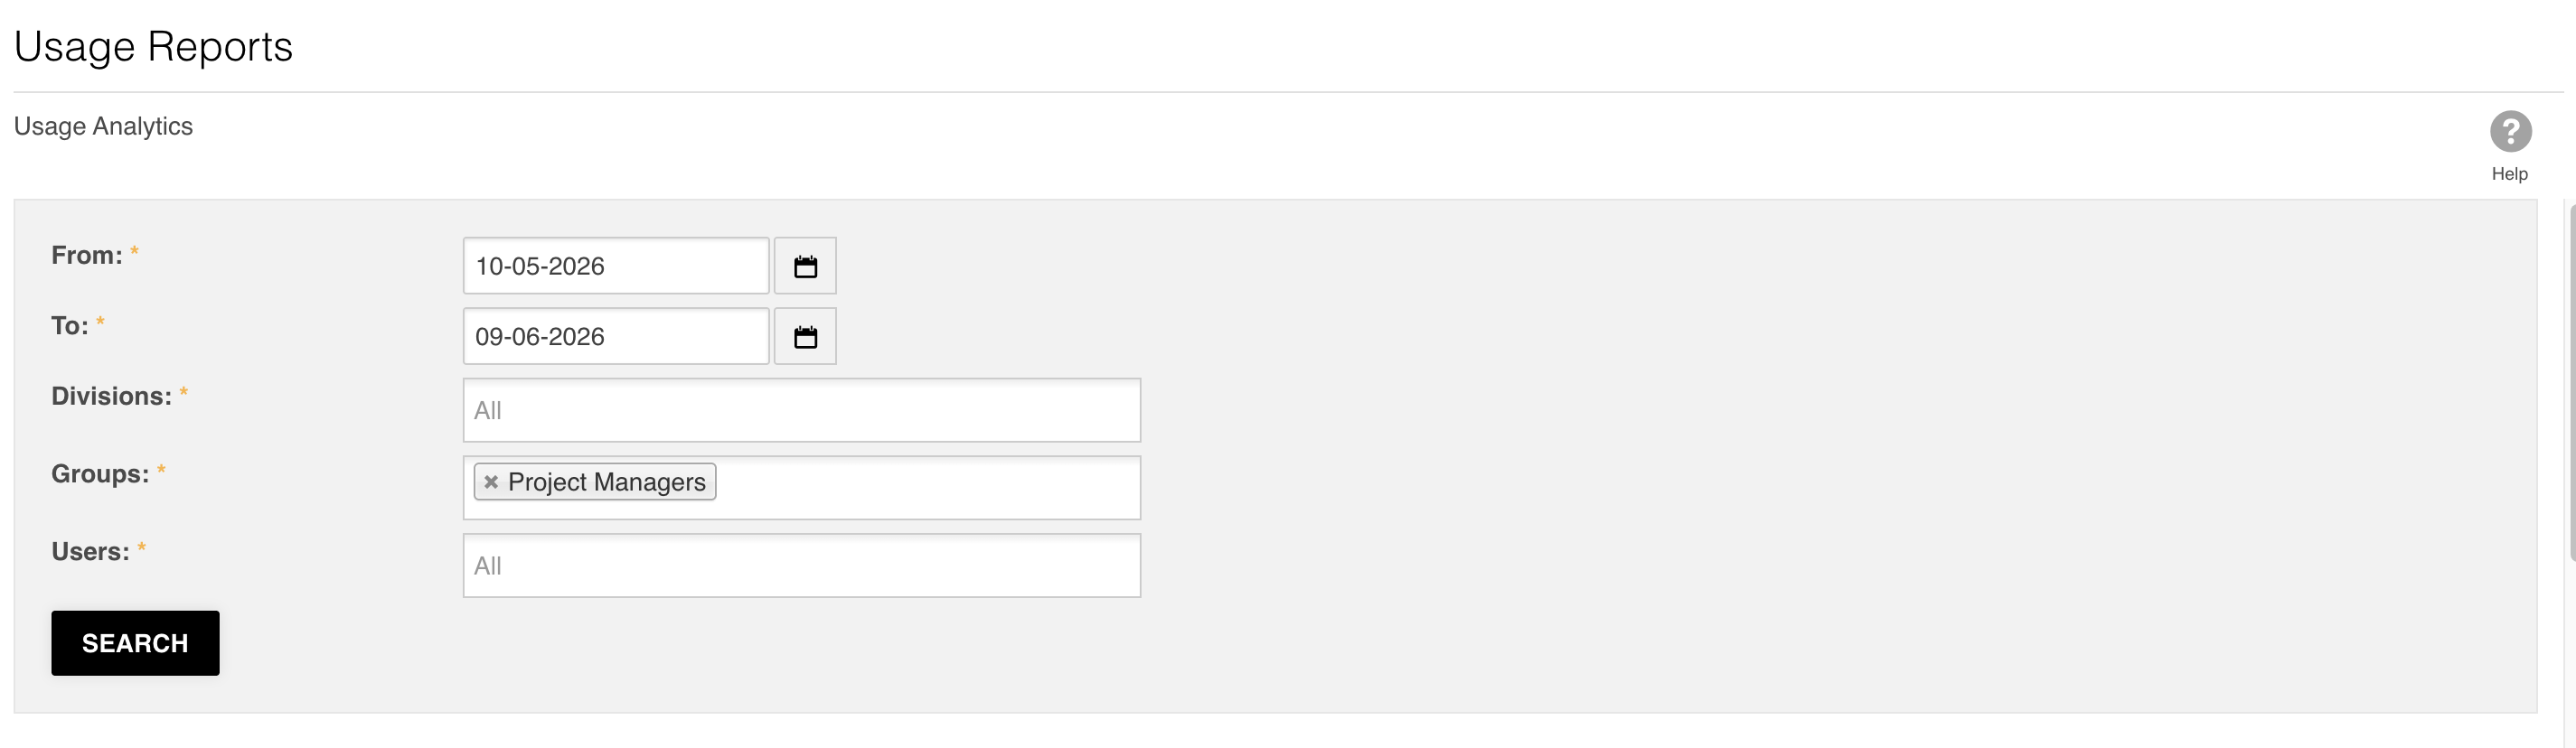
Both report types default to the last 31 days. You can adjust the scope using the filters at the top of the page:
- Date range: Use the From and To date fields to set a custom reporting period.
- Division: Filter the report down to a specific division.
- Group: Narrow results to one or more user groups.
- User: Target the report at specific individuals.
User/Group Reports
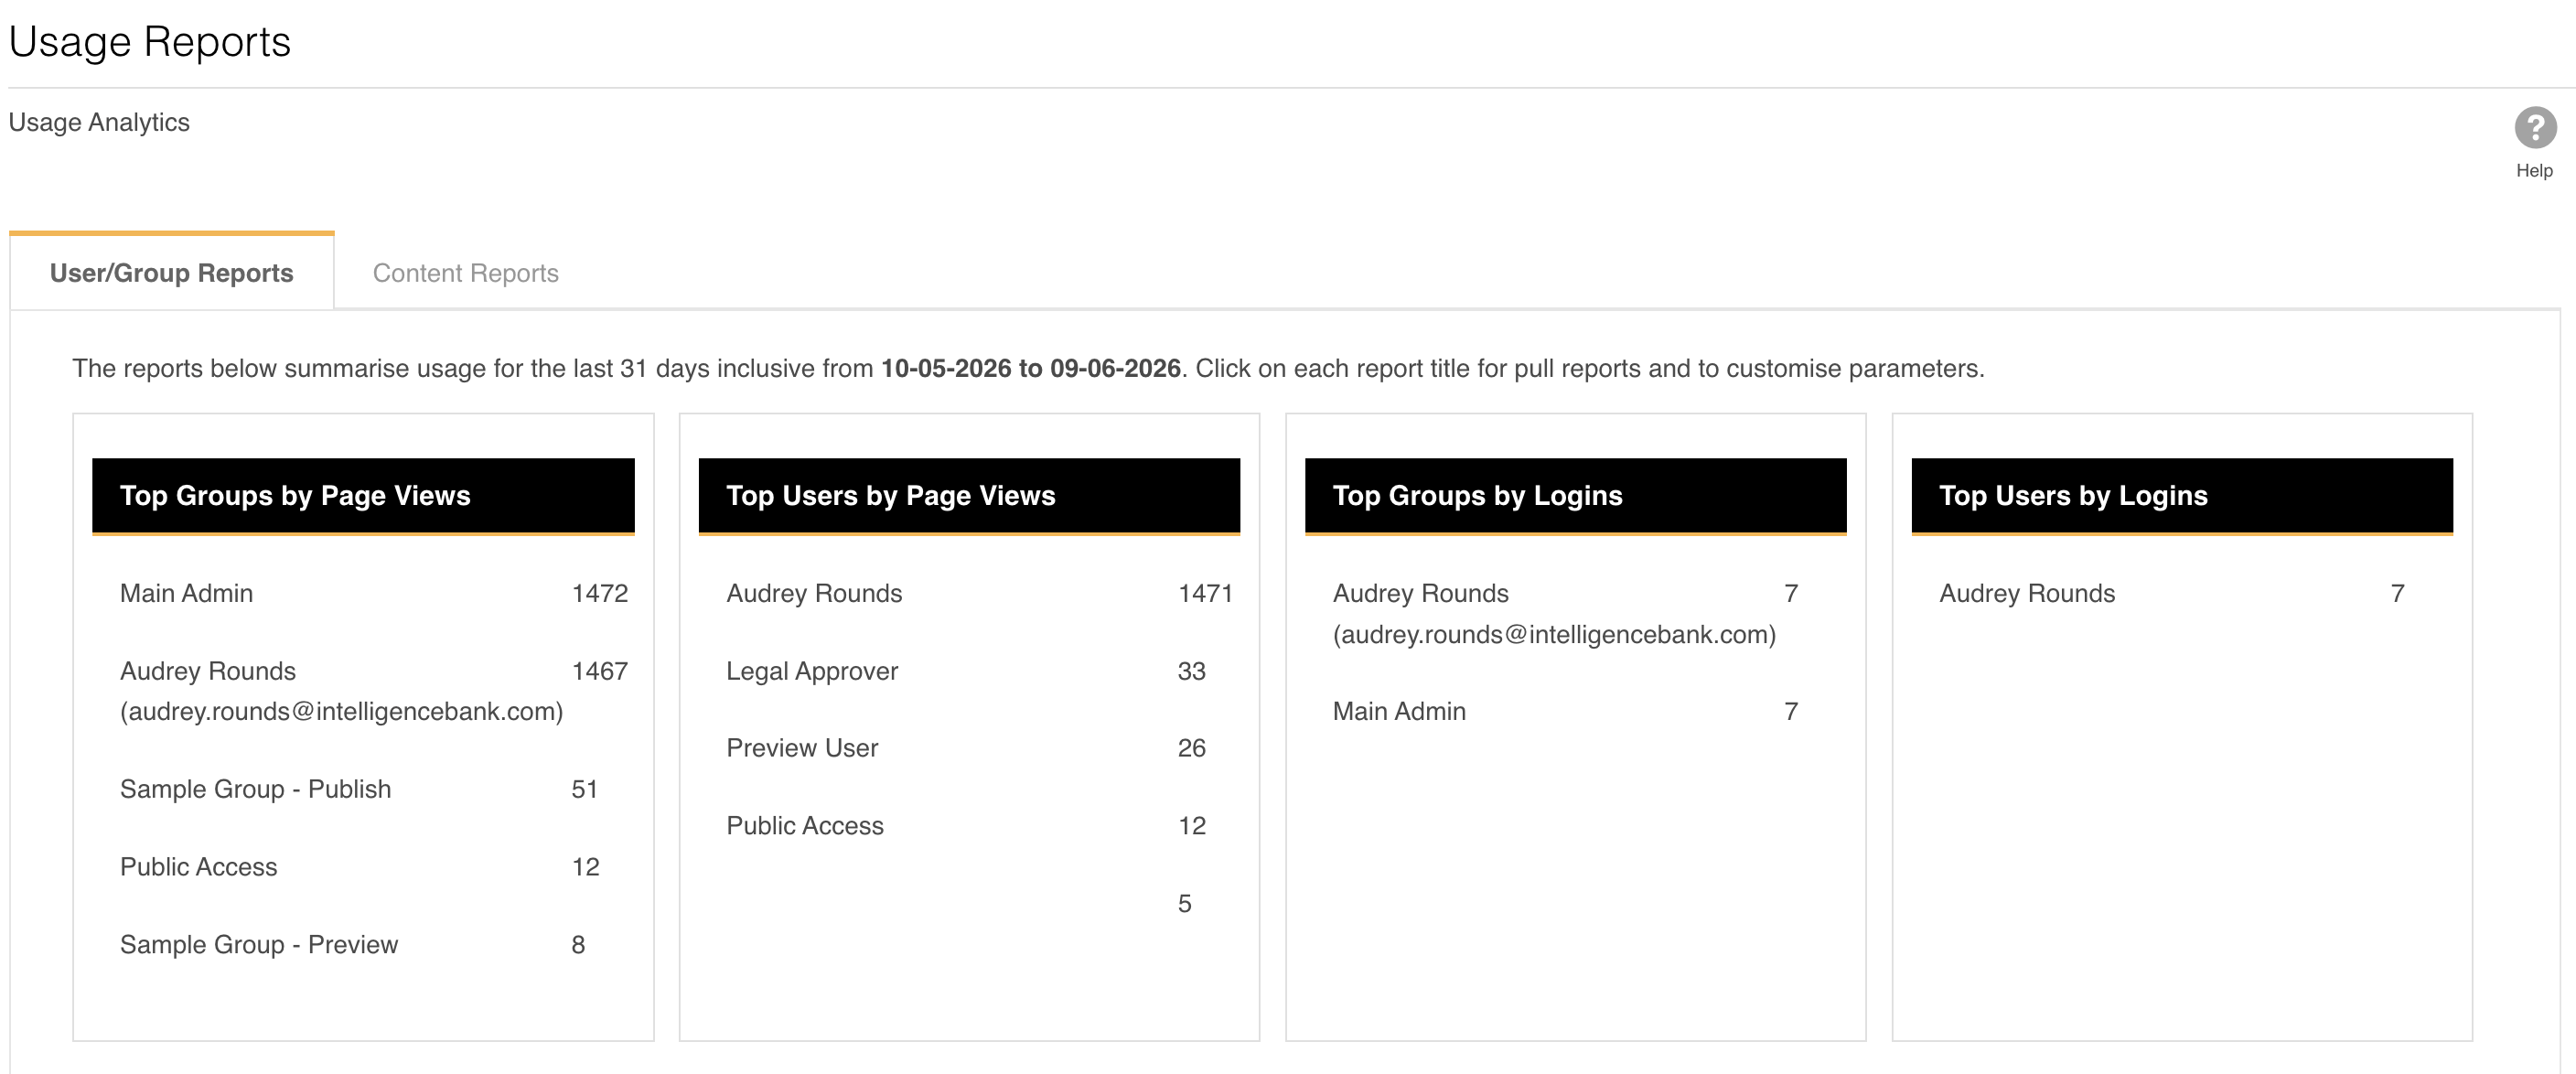
The User/Group Reports tab shows activity data at the user and group level. The following report sections are displayed:
| Report | What it shows |
|---|---|
| Top Groups by Page Views | Groups ranked by the number of page views within the selected period. |
| Top Users by Page Views | Individual users ranked by page views. Useful for identifying your most active platform users - great for targeting feedback requests or champions. |
| Top Groups by Logins | Groups ranked by the number of logins in the reporting period. |
| Top Users by Logins | Individual users ranked by login count. |
| Recently Added Users | A list of dates upon which users have been added to the platform with a count of the number of users added on that date. |
| Recently Deleted Users | A list of dates upon which users have been deleted from the platform with a count of the number of users deleted on that date. |
Beyond identifying your most active users, these reports can help you spot groups with lower engagement. If a group is logging in less than others, it may be worth following up to understand why.
Content Reports
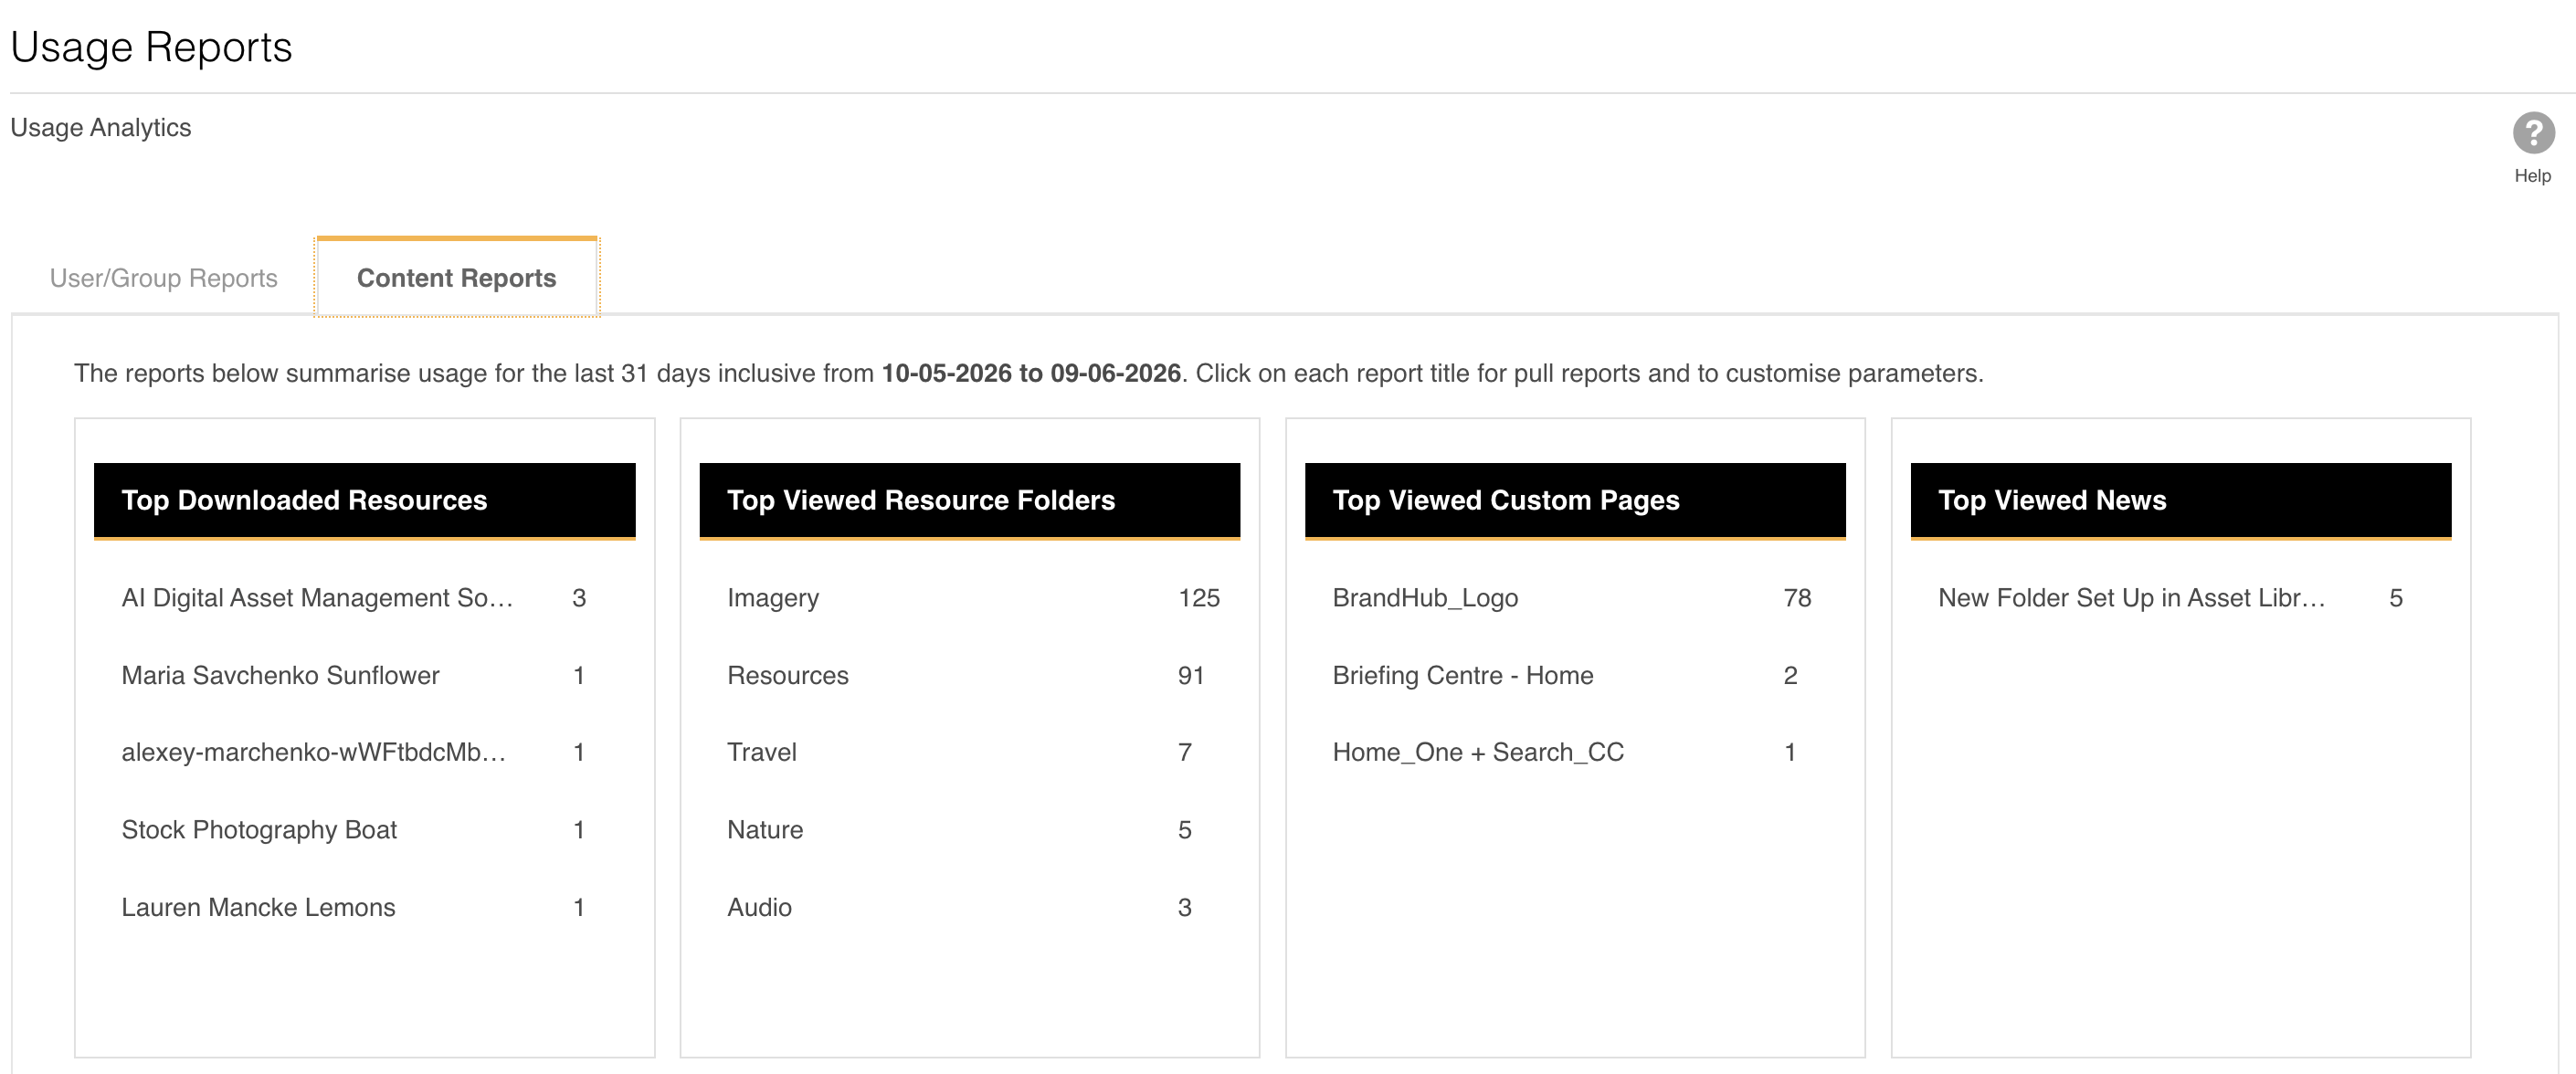
The Content Reports tab shows which assets, folders, and pages are getting the most attention. The same filtering options apply. The following report sections are displayed:
| Report | What it shows |
|---|---|
| Top Downloaded Resources | Assets ranked by download count. Helps you identify which files are most in demand. |
| Top Viewed Resource Folders | Folders ordered by most viewed to least. Useful for understanding which areas of your asset library users navigate to most. |
| Top Viewed Custom Pages | Custom pages ordered by view count. Particularly useful if you use BrandHub - this shows which BrandHub pages users are visiting most. |
| Top Viewed News | News articles ordered by view count. Available if you are using the IntelligenceBank News feature. |
| Top Viewed Feeds | Feeds ordered by view count within the selected period. |
Exporting a Report
Each report section on both tabs shows a summary view by default. To see the full list and export it:
- Click the title of any report section (for example, "Top Users by Page Views"). This opens a full, expanded version of the report.
- Use the search or filter options to narrow the results if needed.
- Click Export to download the report as an Excel file (.xlsx) directly to your computer.
Was this article helpful?
That’s Great!
Thank you for your feedback
Sorry! We couldn't be helpful
Thank you for your feedback
Feedback sent
We appreciate your effort and will try to fix the article